Resources
Markers
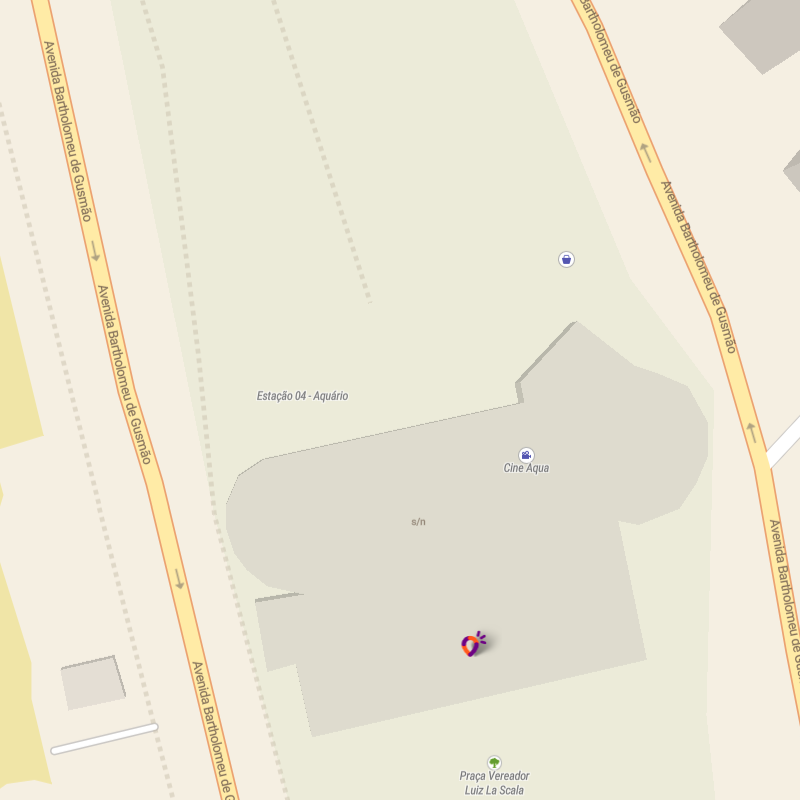
A marker is simply a highlighted point on the map, which can be used to show points of interest (POIs) or simply stops on a route, for example.
To create a simple marker, just use the marker method, passing an object that represents its coordinate:
maplink.marker({
    latitude: -23.986178,
    longitude: -46.308402
});
The result of the above code will be similar to the image:
Text balloon (Popup)
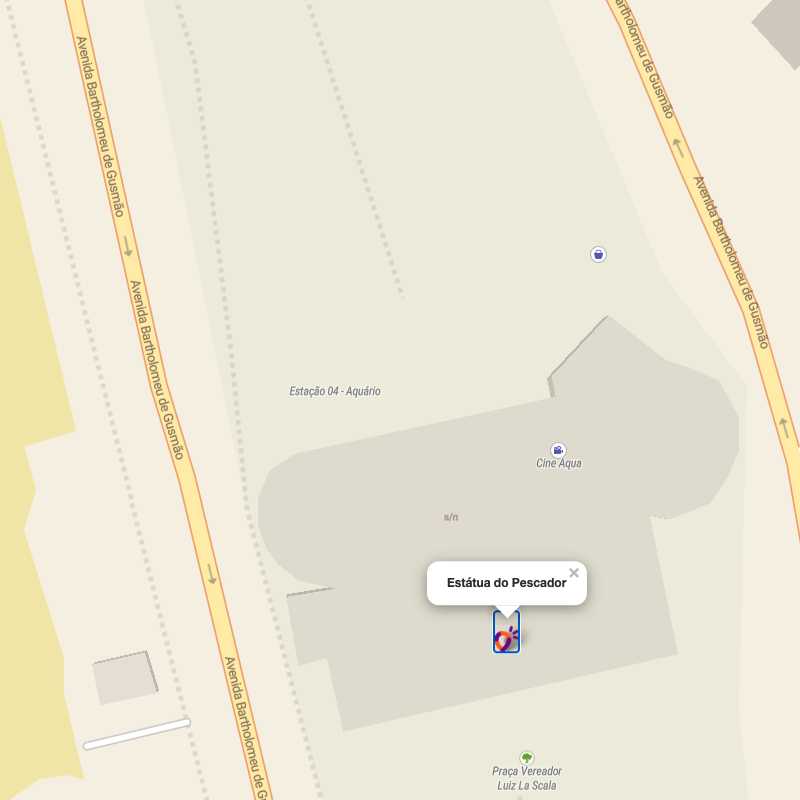
If you want to associate the marker with a text balloon containing its description, you can pass a settings object containing the property popup as the second argument. This property accepts a string, which can contain html formatting:
maplink.marker({
    latitude: -23.986437,
    longitude: -46.308303
}, {
    popup: "<strong>Estátua do Pescador</strong>"
});
The result of the above code will be similar to the image:
Customized icon
You can also define customized icons for your bookmarks, instead of using the standard Maplink icon. To do this, you must first create an icon object using the icon method. It receives three parameters, in order:
- Mandatory string with the path to the icon image, whose format should preferably be png;
- Optional string with the path to the shadow image to be projected by the icon;
- Optional object with
sizeandanchorproperties for the icon, its shadow and the text balloons.
An example of a complete icon definition with its shadow would look like this:
const myIcon = maplink.icon(
    "apontador-icon.png",
    "apontador-icon-shadow.png",
    {
        iconSize: [34, 43],
        shadowSize: [12, 20],
        iconAnchor: [20, 42],
        shadowAnchor: [5, 10],
        popupAnchor: [-3, -32]
    }
);
Since the shadow is an optional attribute of the icons, it can be omitted. The example above without its shadow would look like this:
const myIcon = maplink.icon(
    "apontador-icon.png",
    null,
    {
        iconSize: [34, 43],
        iconAnchor: [20, 42],
        popupAnchor: [-3, -32]
    }
);
Once the icon has been created, simply pass it into the icon property of the settings object of the marker method.
maplink.marker({
    latitude: -23.986437,
    longitude: -46.308303
}, {
    icon: myIcon
});
The icon method is a wrapper for Leaflet’s function of the same name, so to find out more about custom icon settings, visit its documentation at Leaflet – a JavaScript library.
Icons created directly via Leaflet can be passed normally to the marker method.
Lines
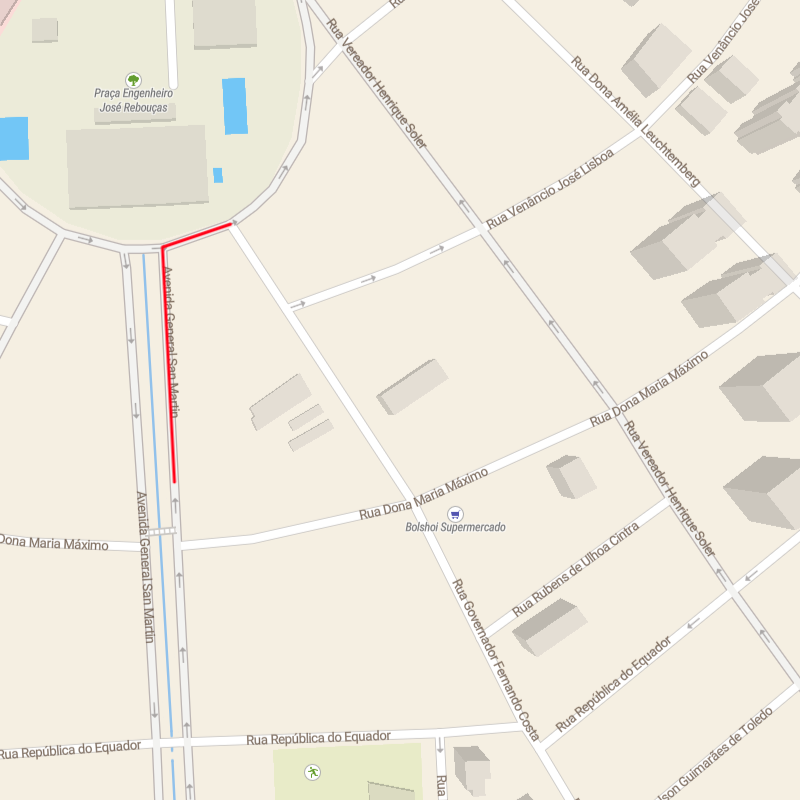
Lines can be drawn on the map, usually to illustrate routes between two or more points. The line method allows you to easily create a line by passing an array of coordinate objects as an argument:
const route = [
    {
        "latitude": -23.983273,
        "longitude": -46.299793
    },
    {
        "latitude": -23.982123,
        "longitude": -46.299857
    },
    {
        "latitude": -23.982008,
        "longitude": -46.299494
    }
];
maplink.line(route);
The result of the above code should be similar to the image:
When no settings are passed, some default values will be used, such as the color of the line. The method’s second argument accepts a configuration object, which can contain the properties:
color– String value to define the line color. Accepts the same CSS color property values, such as color name or hexadecimal code. If not specified, a random color will be used.fitBounds– Boolean value to define whether the line should be framed in the initial rendering of the map. The default value isfalse.
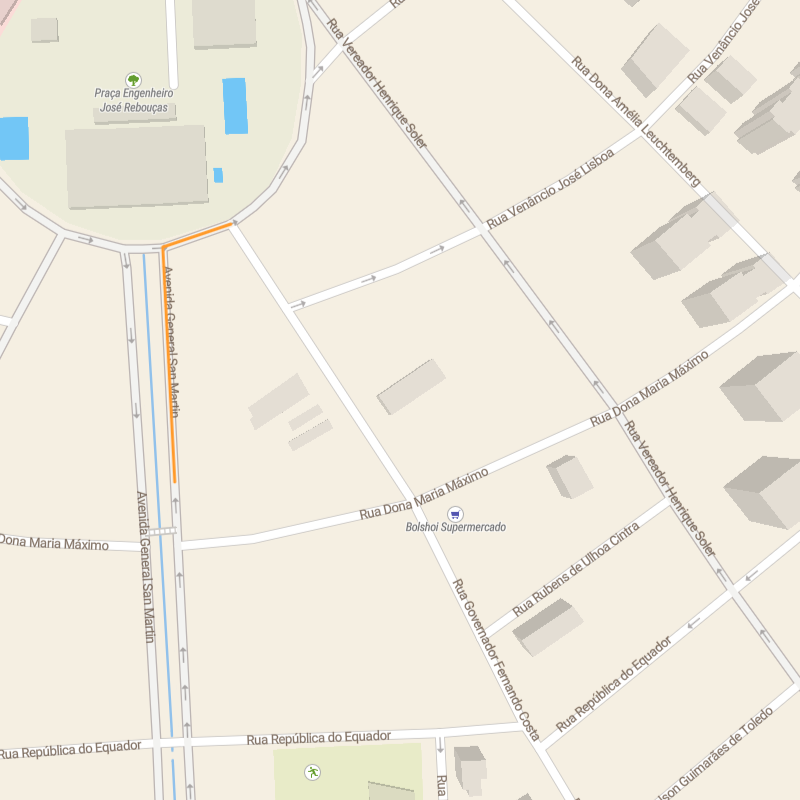
The previous example of a line with its color defined would look like this:
maplink.line(route, {
    color: "#ffa500"
});
Draggable lines
Map Display API allows you to create draggable lines, which allow new points to be added by the user to the map. An example can be found at the link: https://maps.maplink.global/index.html?apiKey=YOUR_API_KEY
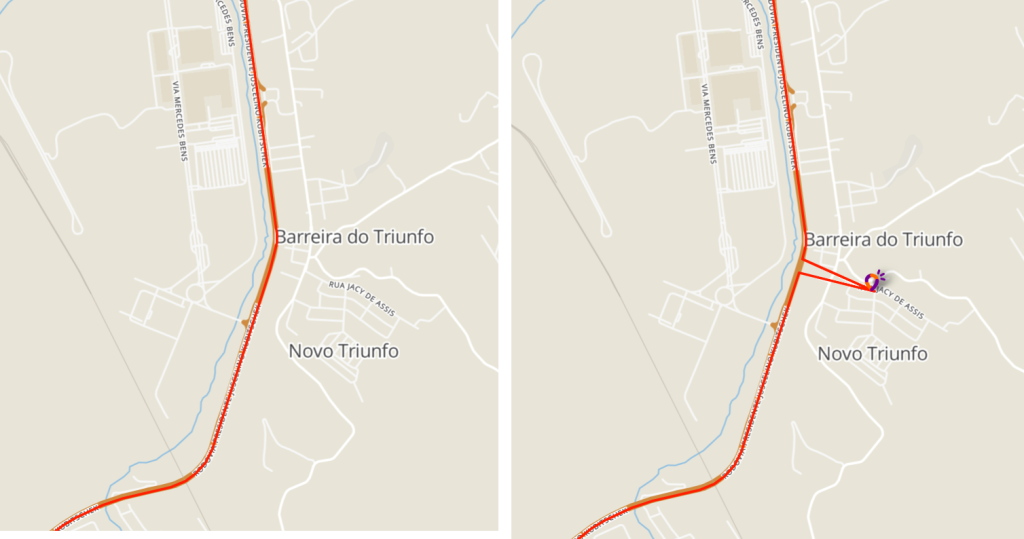
To use this feature it is necessary to use the draggableLine method. The first argument must be an array of coordinate objects, as in the example below:
const route = [
    {
        "latitude": -23.983273,
        "longitude": -46.299793
    },
    {
        "latitude": -23.982123,
        "longitude": -46.299857
    },
    {
        "latitude": -23.982008,
        "longitude": -46.299494
    }
];
maplink.draggableLine(route);
The method’s second argument accepts a configuration object. As with the line method, when this argument is not provided, some default values will be used, such as the line color. The configuration object can contain the following properties:
color– String value to define the line color. Accepts the same CSS color property values, such as color name or hexadecimal code. If not specified, a random color will be used.fitBounds– Boolean value to define whether the line should be framed in the initial rendering of the map. The default value isfalse.snapToClosestPoint– Optional object with options that define what the behavior should be when the user drops the draggable line on the map. If informed, when adding a new point it will be directed to the nearest road on mouse leaveignoreTypeOfPath– Array with road elements that should be ignored when repositioning. Possible values are:["abandoned", "driveway", "parking_aisle", "path", "rail", "service", "track", "trackminor_construction"]debug– Boolean value. Iftrue, the paths where it is possible to drag the point will be highlighted.threshold– Integer with the value of the radius up to which the point can be moved.
 let line2 = maplink.draggableLine(route, {
           color: "#FF1E00",
           fitBounds: true,
           snapToClosestPoint: {
               ignoreTypeOfPath: [
                   "abandoned",
                   "driveway",
                   "parking_aisle",
                   "path",
                   "rail",
                   "service",
                   "track",
                   "trackminor_construction",
               ],
           },
      });
When adding an draggable line, two events are available: addedPoint for when a new point is added and removedPoint for when it is removed.
This way, a new request can be made to the Trip API whenever there is a change, for example.
line.on("addedPoint", (point) => {
     console.log(`[Line 1] - Added `, point);
});

line.on("removedPoint", (point) => {
     console.log(`[Line 1] - Removed `, point);
});